
The International Energy Agency released the 2023 Annual CO2 Emission Report
On March 1st, the International Energy Agency (IEA) released the Report on CO2 Emissions in 2023, which counted the global energy-related carbon emissions in 2023. The report shows that in 2023, the large-scale development of global clean energy limited the growth of carbon emissions, and global carbon emissions increased by 1.1%. Carbon emissions in developed economies have fallen by a record, and have returned to the level of 50 years ago. The main points of the report are as follows:
1. Global carbon emissions will continue to increase in 2023, but clean energy is playing a role.
In 2023, global energy-related CO2 emissions increased by 410 million tons, reaching a record of 37.4 billion tons (Figure 1), of which coal emissions accounted for more than 65% of the increase. In 2023, the global carbon emission growth (1.1%) was significantly lower than the GDP growth (3%). In the past decade, the average annual growth rate of global carbon emissions was slightly higher than 0.5%, and the growth trend was relatively slow, especially compared with the energy crisis in the 1970s and 1980s and the disintegration of the Soviet Union. Clean energy plays a key role in slowing down the emission growth. In 2023, the newly installed capacity of photovoltaic and wind power in global solar reached nearly 540 GW (up 75% year-on-year), and the global sales of electric vehicles increased by 35% to about 14 million. Among them, due to the post-epidemic economic stimulus plan to accelerate the deployment of clean energy projects, global energy-related carbon emissions have increased by about 900 million tons since 2019. With the rapid deployment of five clean energy technologies such as photovoltaic, wind power, nuclear power, heat pump and electric vehicles, the growth rate of carbon emissions has dropped to 1/3 of the original trend.
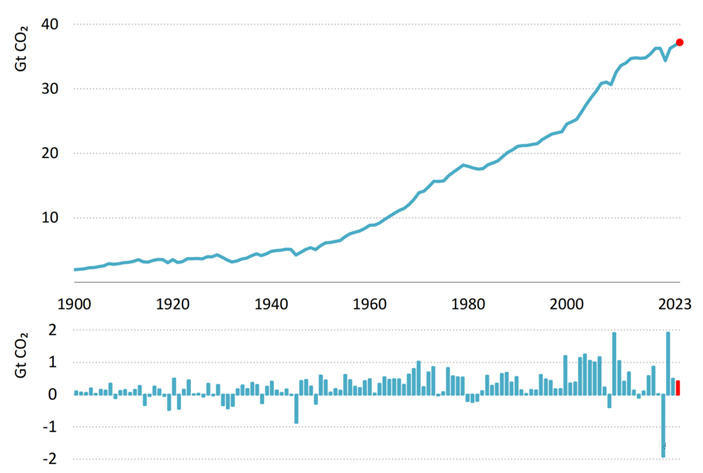
Figure 1 Trends of global energy-related CO2 emissions from 1990 to 2023 (unit: 1 billion tons of CO2)
2. Extreme weather and post-epidemic release control have become important factors for global carbon emission growth.
In 2022-2023, the cumulative net impact of these factors accounts for about 2/3 of the increase in carbon emissions. The specific impacts include: ① the impact of heating/cooling demand brought by temperature on carbon emissions. 2023 was the hottest year on record, but there was also high temperature weather in 2022, so the demand for refrigeration increased moderately and the demand for heating decreased greatly, reducing the CO2 emission by about 120 million tons. ② In 2023, the installed capacity of hydropower in the world increased by 20 GW. However, due to drought, the hydropower generation reached a record low, with a year-on-year decrease of 202 TWh, which could have avoided about 170 million tons of fossil fuel power generation emissions. (3) Due to the recovery of the aviation industry after the epidemic, in 2023, the global air passenger volume (in terms of revenue passenger kilometers) increased by more than 35%, resulting in an increase of about 140 million tons of CO2 emissions. However, the deregulation of China led to a sharp rebound in road passenger demand, with an increase of 50 million tons of CO2 emissions. (4) The energy crisis reduced the output of energy-intensive industries in developed economies, and the carbon emissions decreased accordingly. In 2023, the related carbon reduction reached 25 million tons.
3. In 2023, CO2 emissions of developed economies will drop to the level of 50 years ago.
In 2023, the carbon emissions of developed economies fell by a record 4.5%, and the total emissions were lower than that of 1973 50 years ago. At the same time, the GDP of developed economies increased by 1.7% in 2023, so the decline of carbon emissions in 2023 is the biggest decline of carbon emissions in developed countries during non-economic recession. Two-thirds of the decline in carbon emissions in developed economies was contributed by the power industry. For the first time, renewable energy and nuclear power generation reached 50% of the total power generation, of which renewable energy generation accounted for a record 34%. On the contrary, the proportion of coal and electricity has dropped to a record low (17%), which has reduced the coal demand in developed economies to the level around 1900.
4. Energy-intensive economic growth and unfavorable climate have pushed up CO2 emissions in China and India.
In 2023, China's CO2 emissions increased by 565 million tons, reaching 12.6 billion tons, with an increase rate of 4.7% (Figure 2). Although China occupies a dominant position in the global deployment of clean energy, the development of clean energy failed to meet the surge in energy demand (up 6.1%). Since the epidemic, China's GDP growth has been mainly driven by energy-intensive industries, and fixed assets investment has been concentrated in infrastructure and manufacturing. Coupled with factors such as post-epidemic traffic recovery, water and electricity shortage and extreme weather, carbon emissions have continued to increase. In 2023, India's carbon emissions increased by 190 million tons to 2.8 billion tons, with a growth rate of 7%, exceeding the economic growth (GDP increased by 6.7%), mainly due to the increase in output of steel and cement due to economic recovery and the increase in power demand due to the influence of monsoon climate.
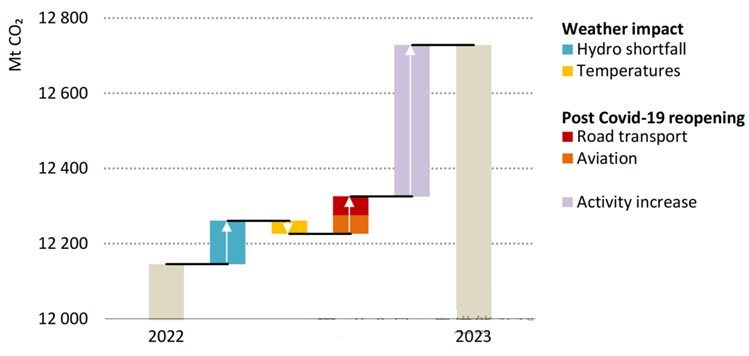
Fig. 2 CO2 emission change and its influencing factors in China from 2022 to 2023 (unit: million tons of CO2).
5. Coal demand in emerging markets and developing economies is the main driving force for global emissions growth.
Since 2019, global energy-related carbon emissions have increased by about 850 million tons, while coal-related carbon emissions have increased by 900 million tons, natural gas carbon emissions have increased slightly, and oil carbon emissions are still lower than 2019 levels. In 2023, among the global energy-related carbon emissions increase, the increase of coal carbon emissions (270 million tons) accounted for about 70%. China and Indian coal combustion emissions increased significantly, which was only partially offset by the decline in developed economies.
Source:https://mp.weixin.qq.com/s/cAX5AJF8Y5v4YSyS3y0a6w