
Carbon Emission Analysis of Typical Kitchen Waste Resource Treatment Project
The amount of kitchen waste in China is huge, and the report issued by the United Nations Environment Programme shows that the amount of kitchen waste in China will exceed 9.0×10⁷t in 2021. In recent years, the classification of domestic waste has been further promoted in all parts of China, and the amount of kitchen waste has been increasing, and the recycling facilities have been accelerated. In 2023, the recycling amounts of kitchen waste in Beijing, Shanghai and Shenzhen will be 1.92×10⁶, 2.45×10⁶ and 2.25×10⁶t respectively, and their carbon emissions have also become the focus of attention. Research shows that 8%~10% of global carbon emissions come from wasted food, of which 6%~14% comes from terminal treatment. Proper treatment and resource utilization can produce carbon emission reduction benefits.
At present, there are many researches on carbon emission of landfill, incineration, anaerobic digestion and aerobic composting, but the results are different because of different boundaries, lack of parameters and missing links. There are few studies on carbon emissions from feeding black hydrangea and producing acid by fermentation, which need to be supplemented.
With the gradual construction of kitchen waste recycling system, the upstream and downstream industrial chains have gradually formed. At present, the emission factor method is widely used in carbon emission reporting and research in various countries and regions, and its focus is on the acquisition of activity data and emission factors. In order to comprehensively evaluate the carbon emission results of kitchen waste treatment system, scholars often use LCA method and UOD method to calculate direct emission, indirect emission and product emission reduction. Many carbon emission accounting methods provide the carbon emission accounting framework and default values of some parameters of kitchen waste treatment in countries, regions or organizations, which can not completely cover the life cycle carbon emission accounting of various kitchen waste treatment technologies, and the existing carbon emission research results are quite different. On July 25th, 2024, Shenzhen issued the first local standard DB4403/T468—2024 on carbon emission accounting guide for kitchen waste treatment projects in China. Based on this standard, this study took five typical projects with different treatment methods as examples, comprehensively and in detail accounted for their life cycle carbon emissions (uniformly converted into CO2 equivalent, calculated by kitchen waste), covering scope I, II, III and carbon compensation.
1 Methods and parameters
1.1 carbon emissions accounting methods
1.1.1 Accounting boundary
The standard uses the emission factor method to calculate carbon emissions, and quantifies the greenhouse effects of CO2, CH4 and N2O. The global warming potentials of the three gases are 1, 27 and 273 respectively, and the biological CO2 is not included in the total emissions. Kitchen waste treatment enterprises can't cover the whole chain in many cases, so the accounting boundary of this standard is kitchen waste treatment projects, including the treatment and transportation process of kitchen waste and "three wastes" (waste water, waste residue and waste gas). Net carbon emissions are divided into scope 1, scope 2, scope 3 and carbon compensation. Scope 1, that is, carbon emissions caused by direct emission of CO2, CH4 and N2O by material transformation within the boundary, such as greenhouse gases generated and dissipated during material treatment and greenhouse gases generated and dissipated by fuel combustion; Scope two, that is, the carbon emissions implied by the energy consumed by mergers and acquisitions inside and outside the border, such as the carbon emissions caused by the production of electricity and heat purchased from outside; Scope 3, that is, the carbon emissions implied by materials purchased and consumed inside and outside the boundary, such as carbon emissions caused by the production of outsourced water and pharmaceuticals. Carbon compensation, that is, the energy/resource products at the export boundary can replace similar products on the market, and the carbon emissions produced by them can be avoided. This part of the avoided carbon emissions is carbon compensation, such as exported heat, electricity, biogas, biodiesel, organic fertilizers, feed raw materials, biological carbon sources, etc.
1.2 Accounting formula
1) Net carbon emission, as shown in Formula (1).

Where: e is net carbon emission, t; Ea is the carbon emission of range 1, t; Eb is the carbon emission of range 2, t; Ec refers to the carbon emission of range 3, t; Er is carbon compensation, t.
2) Carbon emissions from emission sources. The carbon emission accounting of Scope I, Scope II and Scope III adopts the emission factor method, as shown in Formula (2).
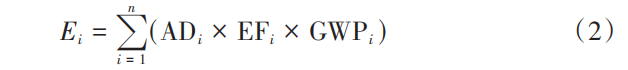
Where: I is the emission source number; Ei is the carbon emission of emission source I, t; ADi is the activity data of emission source I, such as the amount of kitchen waste treated, the electricity purchased and consumed, and the dosage of medicine purchased and consumed. EFi is the emission factor of emission source I, such as the direct emission factor of a kitchen waste treatment process, the electric power emission factor, the chemical emission factor, etc. GWPi is the global warming potential corresponding to the gas emitted by emission source I.
3) Carbon compensation. The accounting of carbon compensation adopts the improved emission factor method, as shown in Formula (3).
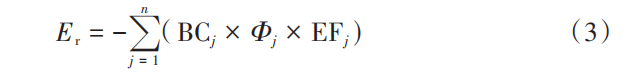
Where: j is the output energy/resource product number; BCj is the quantity of output energy/resource product J, t; Φj is the coefficient of replacing the corresponding products in the market by the energy/resource product J; EFj is the carbon emission factor of the replaced product, t/t.
1.3 Project operation parameters
Five typical technical projects were selected in Shenzhen, including direct mixed incineration, three-phase separation and co-incineration, anaerobic digestion, feeding black hydrangea and fermentation to produce acid.
1) Direct mixed incineration. After the kitchen waste is temporarily stored in the storage pit for several days, the stored materials enter the incinerator for incineration and power generation, and the leachate is treated and purified. Power consumption of equipment operation and emission reduction of power generation are the main sources of net carbon emissions, and the emissions mainly depend on equipment level and material properties.
2) Three-phase separation and collaborative incineration. After pretreatment and three-phase separation of kitchen waste, oil is used to make biodiesel, solid residue is used for incineration and power generation, and sewage is discharged after reaching the standard. Power consumption of equipment operation, oil utilization and power generation emission reduction are the main sources of net carbon emissions, and the emissions mainly depend on equipment level and material properties.
3) Anaerobic digestion. After pretreatment and three-phase separation of kitchen waste, oil is used to make biodiesel, slurry is used for anaerobic digestion, and sewage is discharged after reaching the standard. Power consumption of equipment operation, oil utilization and biogas utilization are the main sources of net carbon emission, and the emission mainly depends on the process used, operation and material properties.
4) Feeding the black hydrangea. After pretreatment and three-phase separation of kitchen waste, the oil is used to make biodiesel, the solid residue is used to feed the black bug, the harvested worm can be used as excellent high-protein feed, and the worm manure can be used as organic fertilizer. The separated liquid is used for fermentation to produce acid or discharged after treatment reaches the standard. Power consumption of equipment operation, utilization of oil, reduction of feed and fertilizer are the main sources of net carbon emission, and the emission mainly depends on the operation situation and material properties.
5) Fermentation to produce acid. After pretreatment of kitchen waste, oil is used to produce biodiesel, separated liquid is used to produce acid by fermentation, and acidified liquid is used as biochar source for sewage treatment. Power consumption of equipment operation, oil utilization and emission reduction of biological carbon sources are the main sources of net carbon emission, and the emission mainly depends on the operation situation and material properties.
2 Results and discussion
2.1 carbon emission results of typical projects
Using the established carbon emission accounting methodology, the project operation parameters are input, and the missing data are replaced by the results of literature research. The BOD of wastewater is 60000mg/L, and TN is 3000 mg/L..
The net carbon emission intensity of each technical project is negative, which shows that all the projects involved in this study have carbon emission reduction effect. The carbon emission of each project is 3.38 kg/t; Except for the direct mixed incineration project, the carbon reduction of biodiesel in other projects is 62.00 kg/t.
The net carbon emission intensity (-90.82kg/t) of anaerobic digestion project is the lowest. The carbon emission in range 1 is 52.43kg/t, which mainly comes from CH4 emission from anaerobic digestion of kitchen waste (27.00kg/t) and N2O emission from wastewater treatment (17.68kg/t). Scope of carbon dioxide emissions is 36.74kg/t, mainly from the kitchen waste and wastewater treatment power consumption (33.37kg/t). The carbon emission of scope III is 5.76kg/t, which mainly comes from the drug consumption of wastewater treatment (2.58kg/t) and biogas utilization (2.50kg/t). The carbon compensation is -185.75kg/t, which mainly comes from biogas power generation (-123.75kg/t) and biodiesel (-62.00kg/t). The net carbon emission intensity of kitchen waste anaerobic digestion calculated by relevant researchers is -129.20~-88.20kg/t, which is consistent with the results of this study. The net carbon emission of anaerobic digestion calculated by Zhang Dong is -35.80kg/t, which is higher than the result of this study. The analysis reason is that it does not consider the carbon compensation of biodiesel.
The net carbon emission intensity (-81.04kg/t) of acid production by fermentation is at the second lowest level. The carbon emission in the first range is 0, mainly because the fermentation process is controlled in the acid production step, no gas is produced, and no waste water and waste residue are produced, so the related direct emission is avoided. The range of carbon dioxide emissions is 19.32kg/t, which mainly comes from the electricity consumption of kitchen waste acid production (15.95kg/t). Scope III carbon emission is 2.23kg/t, mainly due to the consumption of NaClO and NaOH. The carbon compensation is -102.59kg/t, which mainly comes from biological carbon source (-40.59kg/t) and biodiesel (-62.00kg/t). Zhang et al. calculated that the carbon footprint of the centralized treatment facility for acid production from kitchen waste fermentation in Shenzhen is -6.86kg/t, mainly because of its high power consumption (39kWh/t), low biodiesel yield (0.014t/t) and low methanol (biological carbon source substitute product) emission factor (0.279kg/kg).
The net carbon emission intensity (-80.96kg/t) of the three-phase separation co-incineration project is close to that of anaerobic digestion and fermentation to produce acid, which is in the middle level. The carbon emission in range 1 is 23.59kg/t, mainly from N2O emission from kitchen waste incineration and wastewater treatment (18.75kg/t). Scope II carbon emission is 67.17kg/t, which mainly comes from the operating power consumption (63.79kg/t) of incineration plants (including incineration and "three wastes" treatment facilities). The carbon emission of scope III is 7.21kg/t, which mainly comes from the consumption of hydrated lime, NaOH, activated carbon and water. The carbon compensation is -178.93kg/t, which mainly comes from incineration power generation (-116.93kg/t) and biodiesel (-62.00kg/t). The net carbon emission of kitchen waste incineration calculated by Zhang et al. is -11.02kg/t, which is consistent with the results of this study. Zhang Dong calculated that the net carbon emission of dry incineration of kitchen waste was 46.90kg/t, of which the carbon compensation of incineration power generation was -133.40kg/t, but it did not consider the carbon emission reduction of biodiesel, so the carbon emission result was higher.
The carbon emission intensity (-41.78kg/t) of the feeding project of Black Spike is higher than that of anaerobic digestion, three-phase separation and co-incineration and fermentation acid production, which is at the second highest level. The first range is 37.66kg/t, which mainly comes from N2O emission from wastewater treatment and CH4 and N2O emission from waste residue treatment (aerobic composting). Scope 2 carbon emission is 33.58kg/t, which mainly comes from the power consumption of kitchen waste and wastewater treatment (30.20kg/t). The carbon emission of scope III is 3.34kg/t, which mainly comes from the drug consumption of wastewater and waste gas treatment (3.30kg/t). The carbon compensation is -116.36kg/t, and the organic fertilizer, feed raw materials and biodiesel are -34.56 kg/t, -19.80 kg/t and -62.00kg/t respectively. Mertenat et al. obtained that the net carbon emission intensity of feeding Black Spike was 34.59kg/t, which was much higher than that of this study, because the calculated carbon compensation was -15.14kg/t, and the emission reduction of organic fertilizer and biodiesel was not considered. The carbon footprint calculated by Zhang et al. for feeding black hydrangea with kitchen waste is -12.86kg/t, which is much lower than that in this study, mainly because of its low biodiesel yield (0.0015t/t). Zhang Dong's calculation of the net carbon emission of black hydrangea cultivation is -55.69kg/t, which is close to the results of this study. Its facilities are highly modernized, the calculated carbon emission of power consumption is high (160.00kg/t), and the corresponding carbon compensation (-274.10kg/t) is very low.
The net carbon emission intensity of direct mixed incineration is -3.01kg/t, which is at the highest level. The carbon emission in the first range is 16.09kg/t, which mainly comes from N2O emission from kitchen waste incineration and wastewater treatment (13.96kg/t). Scope II carbon emission is 54.77kg/t, which mainly comes from the operating power consumption (51.40kg/t) of incineration plants (including incineration and "three wastes" treatment facilities). The carbon emission of scope III is 7.21kg/t, which mainly comes from the consumption of hydrated lime, NaOH and water. The carbon compensation is -81.08kg/t, which comes from incineration power generation. Compared with the three-phase separation co-incineration, the direct co-incineration of kitchen waste has high carbon emission, mainly because it does not export biodiesel and the calorific value of the material is low.
2.2 carbon emission analysis
2.2.1 Scope 1
Scope 1 Carbon emissions are at the highest or second highest level in all parts, accounting for 0~55%, which is an important emission source. Scope of Incineration-Carbon emission mainly comes from N2O emission from incinerators, which can be controlled by improving the flue gas emission control technology and pollutant concentration monitoring level of incinerators. CH4 and N2O emissions from the anaerobic digestion of kitchen waste, feeding of black hydrangea and wastewater treatment can be controlled by optimizing operation parameters, improving gas collection and treatment system of facilities and improving pollutant concentration monitoring level. Due to the reaction conditions and no waste water, the range of acid production by fermentation-carbon emission is zero, but the monitoring and control of greenhouse gas production should also be strengthened.
2.2.2 Scope II
Scope II carbon emissions are at the highest or second highest level in all parts, accounting for 39%~90%, which is an important emission source, most of which comes from the power consumption of treatment facilities, and the power consumption of collection and transportation (3.38kg/t) contributes less to carbon emissions. For the five technologies selected in this study, although the carbon emission of power consumption is relatively large, the feasibility of reducing power consumption is not high. The future treatment facilities will gradually realize automation, informationization and intelligence, and it is difficult to control power consumption at a very low level. We can reduce this emission by using waste heat and green electricity to participate in the optimal allocation of energy in urban systems.
2.2.3 Scope III
Scope 3 carbon emissions are at the lowest level in all parts, accounting for 4%~10%, with a small contribution. It can improve the efficiency of resource utilization and the accuracy of data through precise operation control, accurate monitoring and measurement, realize the low-carbon and intensive development of enterprises, and provide high-quality data for local and industrial carbon emission databases.
2.2.4 carbon compensation
Carbon offset is the main contributor to emission reduction, mainly from the output of alternative products, including electricity, biodiesel, organic fertilizers, feed raw materials, biological carbon sources and so on. The carbon compensation of exporting biodiesel is considerable, which is an energy utilization method of kitchen waste. In response to the current national energy strategy demand, the potential of emission reduction can be further exerted by increasing the yield and reducing energy consumption and drug consumption. For incineration treatment, the heat generation efficiency can be improved and biodiesel can be made to reduce carbon emissions by improving pretreatment facilities such as pressing and extracting oil. In addition, cogeneration technology can improve heat utilization efficiency and further reduce carbon emissions. Fermentation acid-producing technology can convert high-concentration pollutant wastewater into biological carbon source for utilization, and can combine fermentation acid-producing technology with anaerobic digestion technology and feeding black hydrangea technology to use high-concentration organic wastewater for acid production, further reducing carbon emissions.
2.2.5 Uncertainty analysis
For the technology of three-phase separation, co-incineration, anaerobic digestion and feeding of black hydrangea, the distribution of material flow after three-phase separation, that is, the yield and physical and chemical indexes of solid phase, oil phase and water phase, has great influence on the results. For example, there are differences in calorific value and power generation of solid phase with different yield and moisture content as incineration feed, and there are differences in N2O released when treating wastewater with different TN content. The sampling analysis results of incineration feed and calorific value are relatively high due to the influence of residents' eating habits and seasons. The TN content of wastewater is measured by the project, which is close to the existing research results. The facility perfection and modernization level are decisive factors for the power consumption of treatment. In this study, the direct mixed incineration and three-phase separation co-incineration are selected as the higher level, the anaerobic digestion project and the feeding of black hydrangea are the middle level, and the fermentation acid production project is the lower level. The consumption of treatment chemicals accounts for a small proportion and has little influence on net carbon emissions. For the carbon compensation of resource products, the yield of products is the key factor, such as power generation, biodiesel, organic fertilizer, feed raw materials and so on. The yield of biodiesel is measured by the project, which is slightly higher than the existing research results, and the yield of organic fertilizer and feed raw materials is slightly lower than the existing research results.
3 Conclusion
From low to high, the net carbon emission intensity of kitchen waste treatment technology projects is anaerobic digestion (-90.82kg/t) < acid production by fermentation (-81.04kg/t) < three-phase separation and co-incineration (-80.96kg/t) < feeding black flies (-41.78kg/t) < direct mixed incineration (-3 No matter what technology is adopted, pressing and oil extraction treatment can produce biodiesel, improve material properties, improve resource utilization and reduce carbon emission of the project. Fermentation acid production technology can use high-concentration organic wastewater to produce biological carbon source, which can change carbon emission into carbon compensation. This technology can be combined with technologies such as anaerobic digestion, feeding black hydrangea, etc., and the wastewater treated by kitchen waste can be fermented to produce biological carbon source, which can further reduce carbon emission. The project can use waste heat, green electricity, etc. to reduce the carbon emissions in the second range and optimize the energy allocation of the urban system. The data of carbon emission accounting in kitchen waste treatment industry is still quite scarce, especially the direct emission factors in the treatment process and the emission factors of carbon compensation products. Relevant enterprises should strengthen data collection and monitoring to provide data support for urban "double carbon" work. Government departments should continue to promote the classification of domestic waste and constantly improve the relevant supporting policies and systems for carbon emission reduction.
Source:https://mp.weixin.qq.com/s/9-fmUK-8wwEJarprp9EtHw?scene=1&click_id=23