
IRENA Releases
On July 10, the International Renewable Energy Agency (IRENA) released the "Renewable Energy Statistics 2025" report. It provides statistical data for 2015-2024 power generation capacity, actual power generation for 2015-2023, and renewable energy balances for over 150 countries and regions for 2022-2023. The key points are as follows:
1. Rapid Growth in Renewable Power Generation
In 2023, global total power generation reached 29,867 Terawatt-hours (TWh). Renewables accounted for 29.9% of global generation, totaling 8,928 TWh; the remaining 70.1% (20,939 TWh) was provided by fossil fuels, nuclear power, pumped hydro, and other non-renewable sources.
From 2012 to 2023, global total power generation grew at an average annual rate of 2.5%, while renewable power generation developed rapidly at a Compound Annual Growth Rate (CAGR) of 5.9%, far surpassing non-renewables (1.3%). In 2023, renewable power generation increased by 5.6% year-on-year, compared to a 1.2% growth for non-renewables. Since 2010, the largest growth among renewables came from variable renewables like solar and wind, which together accounted for 13.2% of global power generation in 2023, a 15.7% increase from 2022.
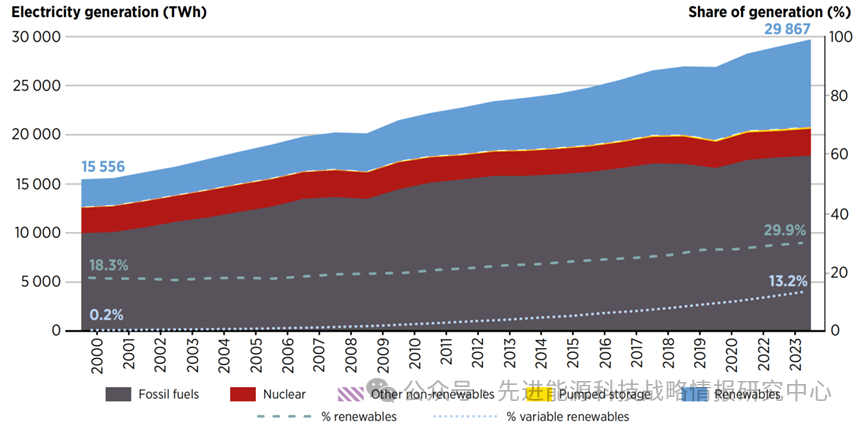
Figure 1: Global Power Generation by Energy Source, 2000-2023 (Left axis, TWh) and Share of Renewable Power Generation (Right axis, %)
2. Steady Increase in Share of Variable Renewable Energy
Over the past 25 years, the composition of renewable energy has diversified significantly. Although hydropower (excluding pumped storage) remains the leading source of renewable electricity, the share of variable renewable energy (wind and solar) in the energy mix has steadily increased, rising from 1.1% of renewable generation in 2000 to 44.0% in 2023.
In 2023, hydropower was still the largest source of renewable electricity, generating 4,270 TWh, a decrease of 72 TWh (1.6%) from 2022. Pumped storage generation increased by 5.5 TWh (3.9%). Wind power followed, at 2,304 TWh, a year-on-year increase of 9.8%, lower than the 13.9% growth rate in 2022. Solar power, the fastest-growing renewable in recent years, reached 1,624 TWh in 2023, up 25.2% year-on-year, marking the highest annual growth rate since 2018. Biomass power generation was 632 TWh, up 1.4%; geothermal contributed 98 TWh; and ocean energy was close to 1 TWh.
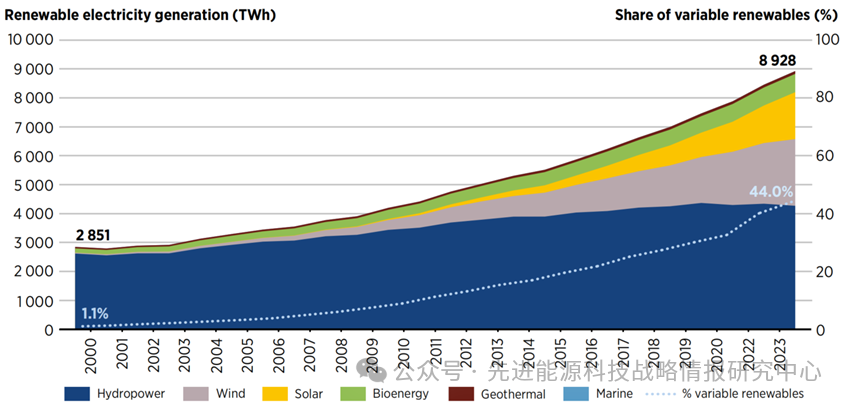
Figure 2: Global Renewable Power Generation by Source, 2000-2023 (Left axis, TWh) and Share of Variable Renewable Energy Generation (Right axis, %)
3. Significant Differences in Regional Energy Structures
In terms of absolute power generation, Asia led globally in renewable electricity output in 2023, reaching 4,008 TWh, a 6.9% increase year-on-year. This growth was driven by all renewable technologies except hydropower (whose share and output declined), with solar and wind showing particularly notable growth. Europe's renewable generation was 1,626 TWh, up 11.4%, fueled by growth in hydropower, solar, and wind, which offset declines in biomass, geothermal, and ocean energy. North America's renewable generation was 1,452 TWh, down 2.9% from 2022; South America's was 1,009 TWh, up 6.0% due to increases across all renewable technologies. The Eurasia region generated 369 TWh of renewable electricity, up 1.8%, as growth in solar and wind compensated for continued declines in hydropower. Africa saw growth in all renewables, with total generation rising 4.5% to 216 TWh. Oceania experienced strong growth, with renewable generation reaching 134 TWh, a significant increase of 18.8%. The Middle East saw a substantial 35% increase in renewable generation, reaching 62 TWh. Central America and the Caribbean generated 52 TWh, down 8.0% year-on-year.
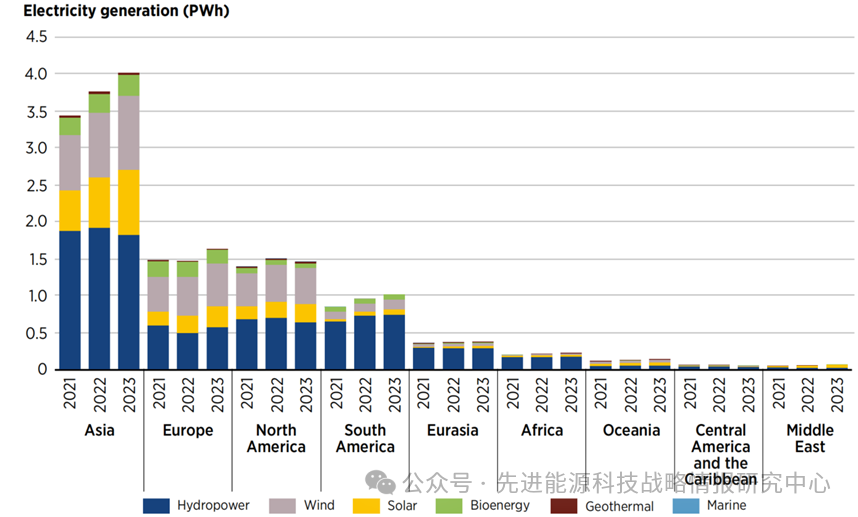
Figure 3: Renewable Power Generation by World Region, 2021-2023 (Unit: Petawatt-hours)
Regarding the regional electricity mix, South America led with 76.8% of its electricity coming from renewables (primarily hydropower, accounting for nearly three-quarters). Europe followed, with renewables comprising 46.2% of its generation, but with a more diversified mix: wind (35.6%), hydropower (34.7%), solar (17.3%), bioenergy (11.7%), and geothermal (0.8%). Oceania ranked third, with 40.7% of its electricity from renewables: hydropower (33.0%), solar (32.0%), wind (25.8%), geothermal (6.2%), and bioenergy (3.0%). North America's share of renewables in its power mix was 26.6%, the same as Asia's share. Both Africa and Eurasia derived 24.1% of their power from renewables, while Central America and the Caribbean had a 20.0% share. The Middle East lagged significantly, with only 4.3% of its electricity from renewable sources.
In 2023, the non-renewable power generation of both the G7 and G20 still exceeded their renewable generation, with their shares of renewables both below the global average of 29.9%. The share for G20 countries was 28.9%, unchanged from 2022, while for the G7 it was 29.5%. The composition of renewables was similar in both groups. In G20 countries in 2023, hydropower accounted for 43.9% of renewable generation, wind for 28.5%, solar for 19.6%, and bioenergy plus minor geothermal for 7.1%. The G7 renewable mix was: hydropower (35.5%), wind (34.1%), solar (19.9%), bioenergy (9.2%), and geothermal (1.3%).

Figure 4: Regional Electricity Mix by Energy Source, 2023 (Unit: %)
4. Rapid Growth in Renewable Power Capacity
By the end of 2024, global renewable capacity reached 4.4 Terawatts (TW), accounting for 46.2% of total installed capacity (9.6 TW). This represented a 15.1% growth from 2023, significantly higher than the 10.4% CAGR from 2018-2023. The capacity of variable renewables (wind and solar) grew by 23.3% compared to 2023, representing 31.2% of total renewable capacity.
Global non-renewable capacity stood at 5.2 TW, constituting 53.8% of total capacity, broken down as follows: fossil fuels 4.5 TW (47.3%), nuclear 400 Gigawatts (GW) (4.2%), pumped storage 150 GW (1.6%), and other non-renewables 68 GW (0.7%). Recent trends indicate that renewables have become the fastest-growing source of capacity, while growth of non-renewables has slowed, with some countries even experiencing large-scale retirement of fossil fuel power plants.
In 2024, solar was the largest renewable capacity source, accounting for 42.0% (1,866 GW); followed by hydropower at 28.7% (1,277 GW); wind at 25.5% (1,133 GW); biomass at 3.4% (151 GW); and geothermal at 0.3% (15 GW), plus minor ocean energy. The share of variable renewables (wind and solar) in renewable capacity rose to 67.5%, indicating a shift towards more intermittent energy sources. Solar and wind continued to dominate renewable capacity expansion, together accounting for 97.5% of all new renewable capacity added in 2024, with solar adding 453 GW and wind adding 114 GW. Over the past 24 years, new renewable capacity additions have grown significantly, reaching a record peak of 582 GW in 2024. Furthermore, the share of renewables in global total new capacity has steadily increased, reaching 91.1% in 2024. New non-renewable capacity has remained relatively stable or declined over the years, staying below 90 GW annually since 2019.
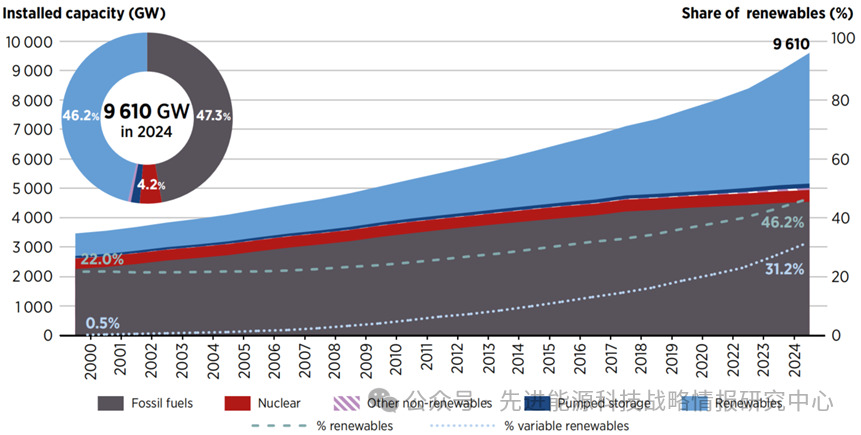
Figure 5: Global Installed Capacity by Energy Source, 2000-2024 (Left axis, GW) and Share of Renewables (Right axis, %)
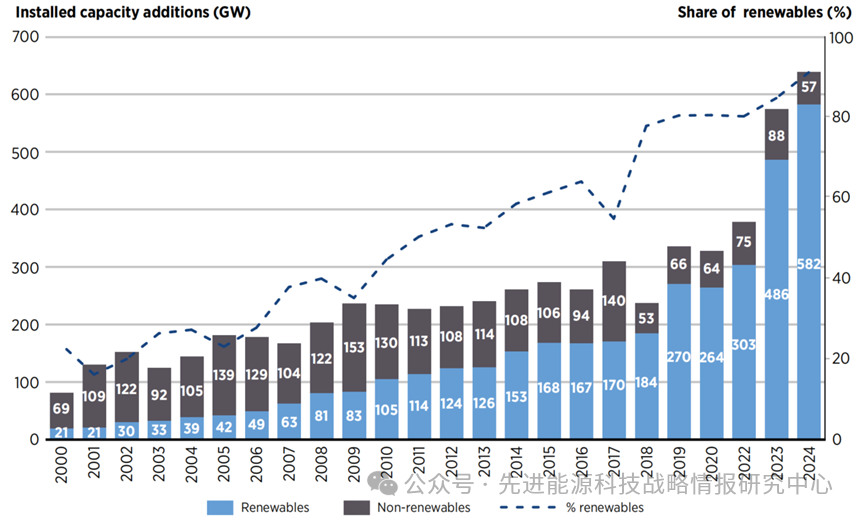
Figure 6: Global New Installed Capacity by Energy Source, 2000-2024 (Left axis, GW) and Share of Renewables (Right axis, %)
Despite 2024 being the year with the fastest renewable capacity growth to date, significant disparities exist among countries/regions. Asia accounted for 71.0% of new renewable capacity in 2024, adding 413.2 GW, while Europe and North America added 71.9 GW and 45.5 GW, respectively. Growth in other regions was much smaller: Central America and the Caribbean added 0.4 GW, the Middle East added 4.0 GW, and Africa added 4.7 GW.
5. Achieving the 2030 Global Renewable Capacity Target Remains Challenging
In 2024, global new renewable capacity addition was 582 GW, with an annual growth rate of 15.1%, the highest annual increase since 2000. Despite this progress, the growth rate is still insufficient to meet the requirement of tripling global renewable capacity to over 11 TW by 2030. If the 2024 growth rate is maintained, global renewable capacity would only reach 10.3 TW by 2030, falling short of the target by 0.9 TW (7.7%).
From 2018 to 2023, the CAGR of global renewable capacity was 10.4%. If this historical trend continues, capacity would only reach 8.0 TW by 2030, resulting in a gap of 3.1 TW (28%) to the target. Achieving the 2030 target requires maintaining an annual growth rate of at least 16.1% starting from 2022. However, since the growth rates in both 2023 and 2024 fell short of this level, the annual growth rate for renewable capacity needs to be further increased to 16.6% over the next six years.
6. Significant Room for Development in Renewable Heat
Among power capacity, power generation, and heat supply, renewables have the lowest penetration in the heat sector. In 2023, only 6.2% of global heat supply came from renewables, totaling 919 Petajoules (PJ); the remaining 93.8% (13,965 PJ) came from fossil fuels, along with minimal nuclear and other non-renewables. The share of renewable heat has increased from 2.5% in 2000, but its growth rate is far lower than that of renewable power generation. In 2023, biomass was the largest source of renewable heat energy, accounting for 90.6%, a share that has remained relatively stable historically; other significant sources included geothermal and solar thermal. Europe leads in renewable heat, accounting for 89.6% of the global total, and representing 30.2% of the region's total heat supply of 2,727 PJ. In 2023, Asia's heat supply was 6,495 PJ, but the renewable share was only 0.4%; the Eurasia region's heat supply was 5,169 PJ, with a 0.5% renewable share; North America's heat supply was 442 PJ, with a 9.6% renewable share.
Source:https://mp.weixin.qq.com/s/Y4m_ZK91MSGX2Izjk1qaCw